


chiffres clés
Dollar Rand (USD/ZAR)
USDZAR - FX0000USDZAR
16.5535
+0.54 %
Dernière cotation : 19h46
Clôture veille :
16.4639
+ Haut :
16.5558
+ Bas :
16.4353
Point pivot :
16.5379
+ Haut annuel :
17.2494
+ Bas annuel:
15.6436
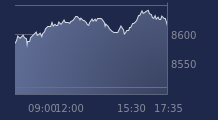
Graphique USD/ZAR sur 5 jours
Cours USD/ZAR sur 5 jours
| 28/07 | 29/07 | 30/07 | 31/07 | 03/08 | Date |
|---|---|---|---|---|---|
| 16.7095 | 16.662 | 16.5095 | 16.5205 | 16.5535 | Dernier |
| -0.43 % | -0.27 % | -0.94 % | +0.10 % | +0.54 % | Var. |
| 16.7808 | 16.7072 | 16.6655 | 16.5039 | 16.4637 | Ouv. |
| 16.8271 | 16.813 | 16.7124 | 16.6231 | 16.5558 | + Haut |
| 16.6435 | 16.5776 | 16.4603 | 16.47 | 16.4353 | + Bas |
| 16.4562 | 16.4685 | 16.4808 | 16.4918 | 16.5105 | MM20 |
| 16.4203 | 16.4242 | 16.4255 | 16.4261 | 16.4314 | MM50 |
| 16.5378 | 16.5385 | 16.5359 | 16.5317 | 16.5306 | MM100 |
Performances historiques de la parité USD/ZAR
| 5 jours | 1 mois | 1er janvier | 5 ans |
|---|---|---|---|
| -1.36 % | +1.76 % | 0.00 % | +14.41 % |
| 1ere resistance | 2eme resistance | 3eme resistance |
| 16.6058 | 16.6910 | 16.7589 |
| 1er support | 2eme support | 3eme support |
|---|---|---|
| 16.4527 | 16.3848 | 16.2996 |
| Court terme | Moyen terme | Long terme |
|---|---|---|
| Haussière | Haussière | Haussière |
Portefeuille Trading
+321.30 % vs +73.28 % pour le CAC 40
Performance depuis le 28 mai 2008