


chiffres clés
Dollar Dollar Singapourien (USD/SGD)
USDSGD - FX0000USDSGD
1.2831
+0.15 %
Dernière cotation : 19h46
Clôture veille :
1.2812
+ Haut :
1.2832
+ Bas :
1.2790
Point pivot :
1.2829
+ Haut annuel :
1.2992
+ Bas annuel:
1.2586
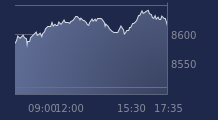
Graphique USD/SGD sur 5 jours
Cours USD/SGD sur 5 jours
| 28/07 | 29/07 | 30/07 | 31/07 | 03/08 | Date |
|---|---|---|---|---|---|
| 1.2926 | 1.2889 | 1.282 | 1.2824 | 1.2831 | Dernier |
| +0.09 % | -0.28 % | -0.53 % | +0.02 % | +0.15 % | Var. |
| 1.2915 | 1.2925 | 1.2888 | 1.2821 | 1.2812 | Ouv. |
| 1.2938 | 1.2934 | 1.2916 | 1.2855 | 1.2832 | + Haut |
| 1.2911 | 1.288 | 1.281 | 1.2809 | 1.279 | + Bas |
| 1.29199 | 1.29165 | 1.29111 | 1.29063 | 1.29019 | MM20 |
| 1.28822 | 1.28844 | 1.28852 | 1.28857 | 1.28868 | MM50 |
| 1.28265 | 1.28278 | 1.28281 | 1.2828 | 1.28284 | MM100 |
Performances historiques de la parité USD/SGD
| 5 jours | 1 mois | 1er janvier | 5 ans |
|---|---|---|---|
| -0.65 % | -0.75 % | -0.19 % | -5.17 % |
| 1ere resistance | 2eme resistance | 3eme resistance |
| 1.2849 | 1.2875 | 1.2895 |
| 1er support | 2eme support | 3eme support |
|---|---|---|
| 1.2803 | 1.2783 | 1.2757 |
| Court terme | Moyen terme | Long terme |
|---|---|---|
| Baissière | Baissière | Haussière |
Portefeuille Trading
+321.30 % vs +73.28 % pour le CAC 40
Performance depuis le 28 mai 2008